|
10.23 Lead Analysis Dashboard - Phase 2
KB 3221, Release Note, CRM Development, 8/26/2025
Version 10.23 introduces a powerful upgrade to the Lead Analysis Dashboard, designed to give you sharper insights and greater control over your lead data. With newly added divisional dashboard filters, you can now segment and compare lead performance by division - whether you're managing a single store or a multi-location operation. These enhancements offer improved visibility into how each branch is performing, empowering you to make faster, data-driven decisions at every level.
Upgrade to 10.23 to take advantage of advanced lead tracking, smarter analytics, and streamlined reporting across all your divisions.
Page Criteria
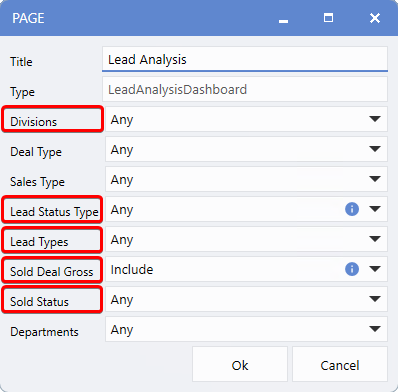
The Lead Analysis Dashboard in Version 10.23 now offers expanded Page Criteria options, giving users greater flexibility and control when analyzing lead performance. For dealerships with multiple divisions, Users can now choose which divisions to include and tailor the data displayed for each selected division.
To enhance usability, new blue hover-tip icons have been added throughout the dashboard, offering helpful explanations of each field and its function.
New Page Criteria Options in the Lead Analysis Dashboard:
-
Divisions: Customize the dashboard view by selecting specific divisions to include.
-
Lead Status Type: Display leads with selected deal statuses created within the chosen date range. When multiple divisions are selected, the division name appears next to each status for clarity.
-
Lead Types: Filter leads by source: Phone, Showroom, or Internet.
-
Sold Deal Gross: Choose to show or hide gross profit details on sold deals. When included, Sold Status options become available.
-
Sold Status: Available when Sold Deal Gross is set to Include. View and filter all sold status types by selecting individual statuses or categories (e.g., Closed, Sold, Delivered). Additional filtering by division is also available. These choices impact both the Sold and Gross sections of the dashboard grid.
Summary View
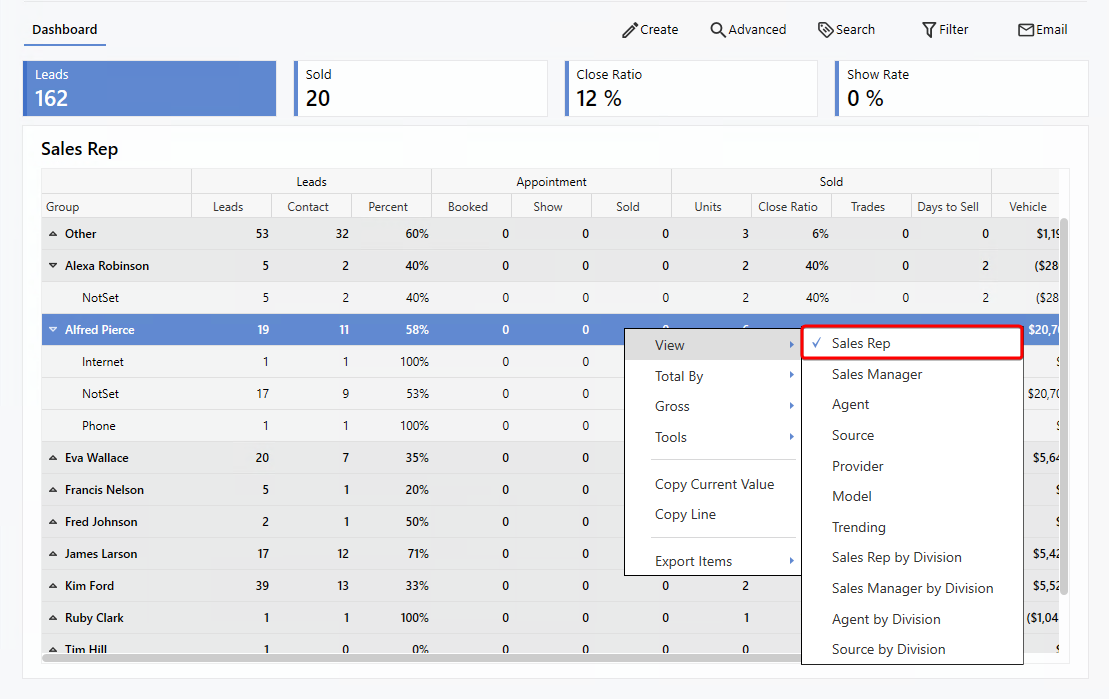
For Dealerships managing multiple divisions, Version 10.23 introduces four new division-based views, expanding the ways you can analyze and compare lead performance across locations.
Note:
These views will are only available for multi-division setups and will not appear for single-division configurations.
1. Sales Rep by Division
2. Sales Manager by Division
3. Agent by Division
4. Source by Division
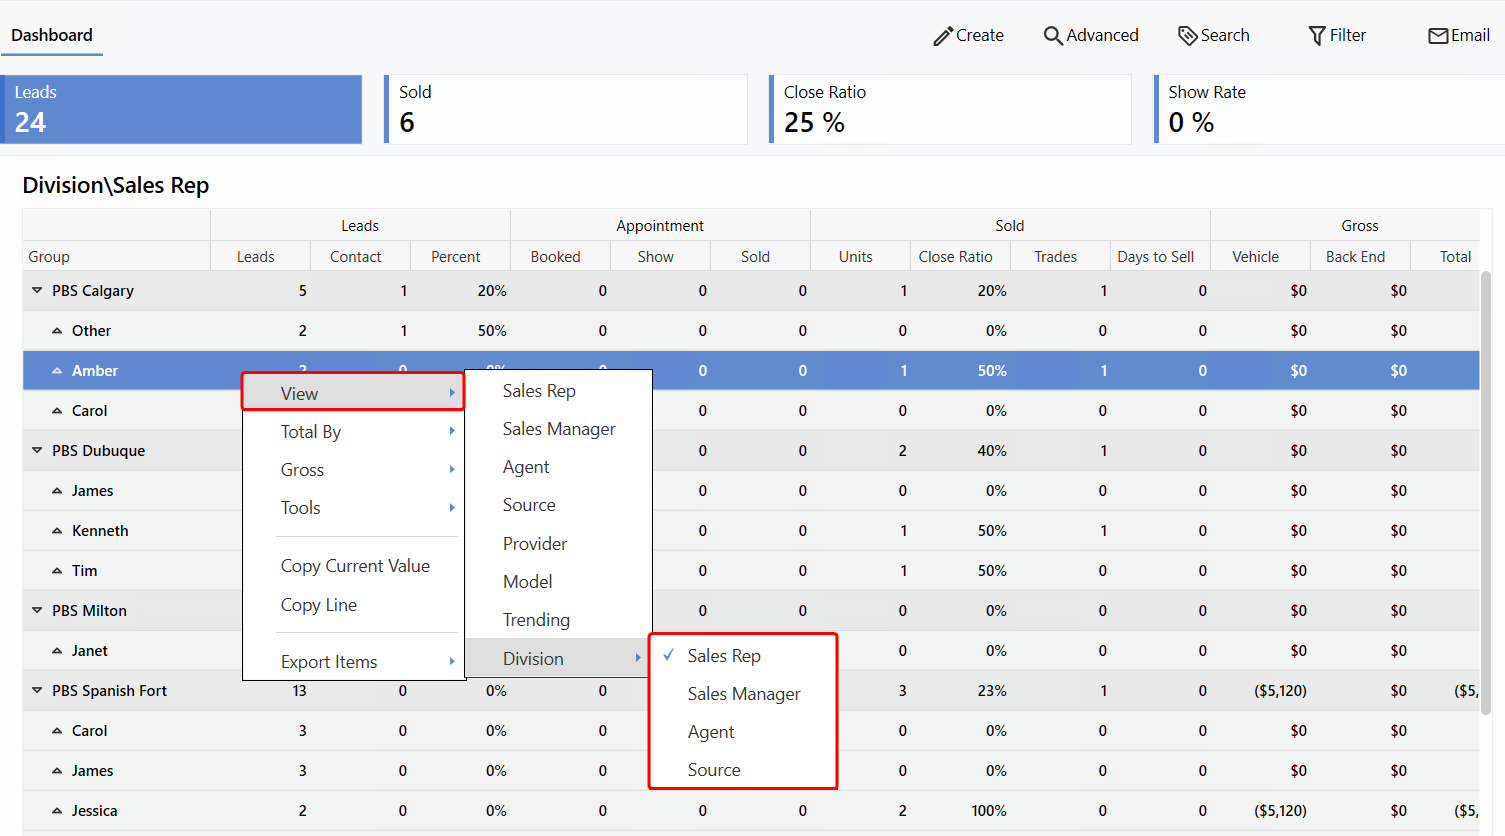
In the Summary View, Users can now choose to display data grouped by division when applicable. Each division section can be expanded or collapsed using the drop-down arrows, allowing for a clear and organized comparison. Additionally, clicking on a Sales Reps name reveals the leads assigned specifically to them. If the non-divisional view is selected, data from all divisions will be shown in a combined format for a broader overview.
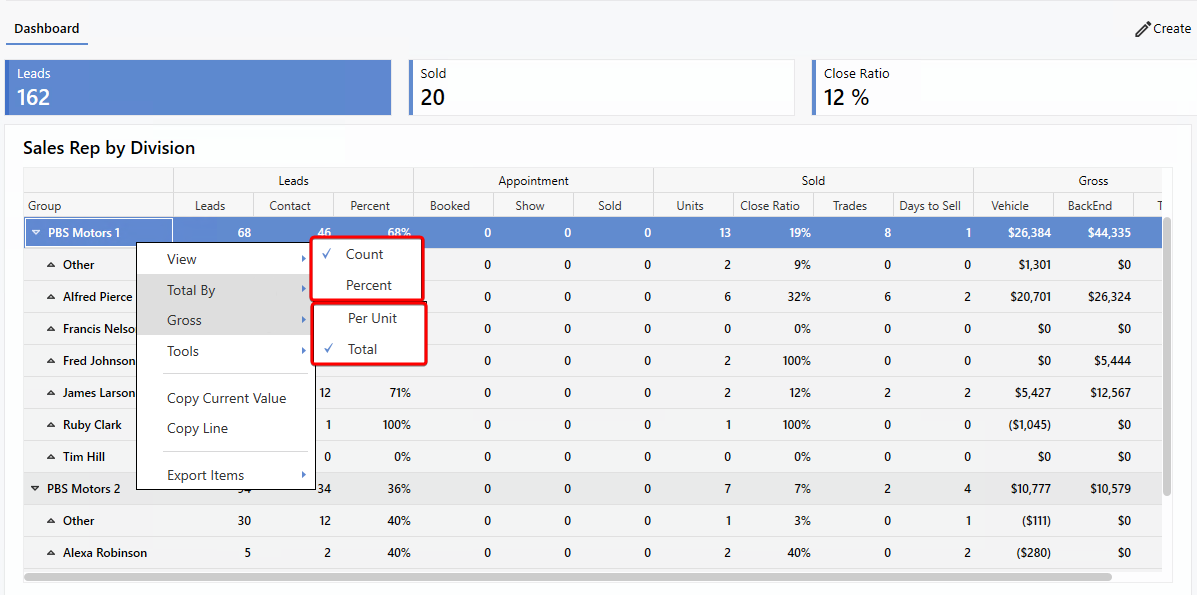
Sales Rep View
Sales Rep by Division View
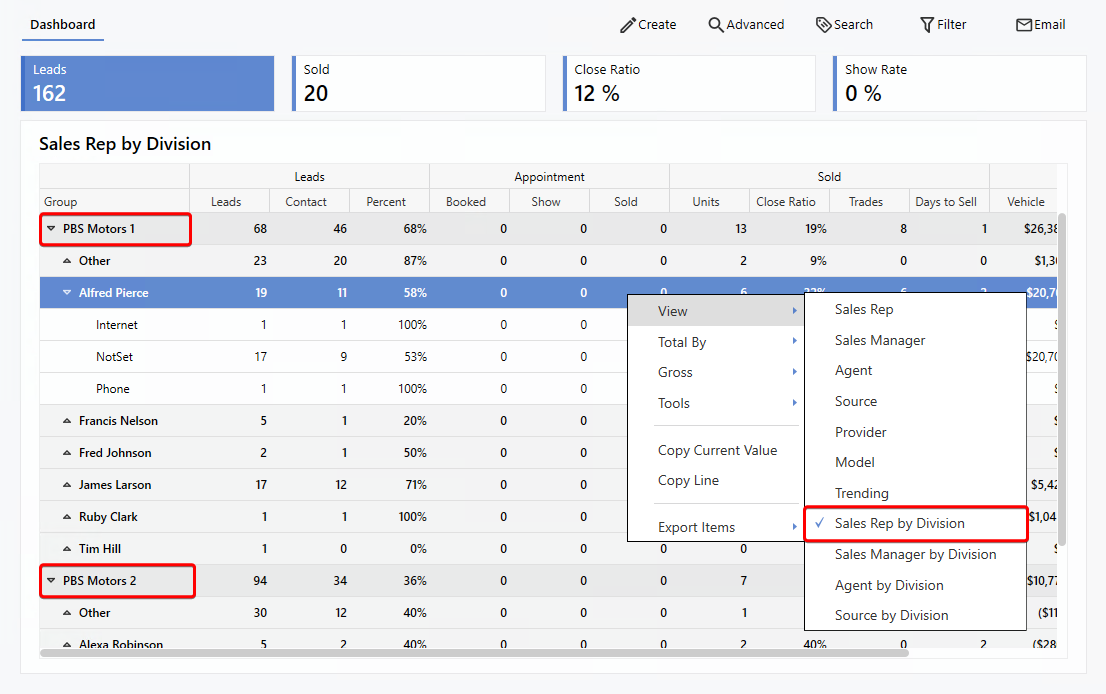
To make the Dashboard easier to navigate and interpret, hover-tip explanations are now available when you hover over row headers. These tooltips clearly describe how each column is calculated, providing instant clarity without leaving the page.
To reduce clutter and improve focus, the
Number
and
Percent
columns in the Summary View now toggle in place of one another. A new
Total By
option in the right-click menu allows you to choose how data is displayed - either as a numerical
Count
or a
Percentage
, based on your preference.
In addition, a new
Gross
toggle has been added to the same menu. This lets you choose whether values in the
Gross
section are shown as an average
Per Unit
or as a
Total
, offering more flexibility in how you view profitability metrics.
|